
Google’s Android has been around for almost a decade, which is an impressive amount of time in itself. But when you also consider how much the mobile OS grew, developed and evolved over these years of existence, it gets even more impressive. In order to celebrate this and prepare for the upcoming launch of Android O a few short weeks from now (allegedly), we have prepared a really interesting discussion on Android distribution over the years.
We will look on how the various versions of the operating system rolled out starting with the year 2012 (the first one in which Google made such data available) and finishing up with 2017, the current year. A very well-respected Android blog also put together a few charts and graphs to show this evolution, and you can see them here.
Android in the Past 5 Years
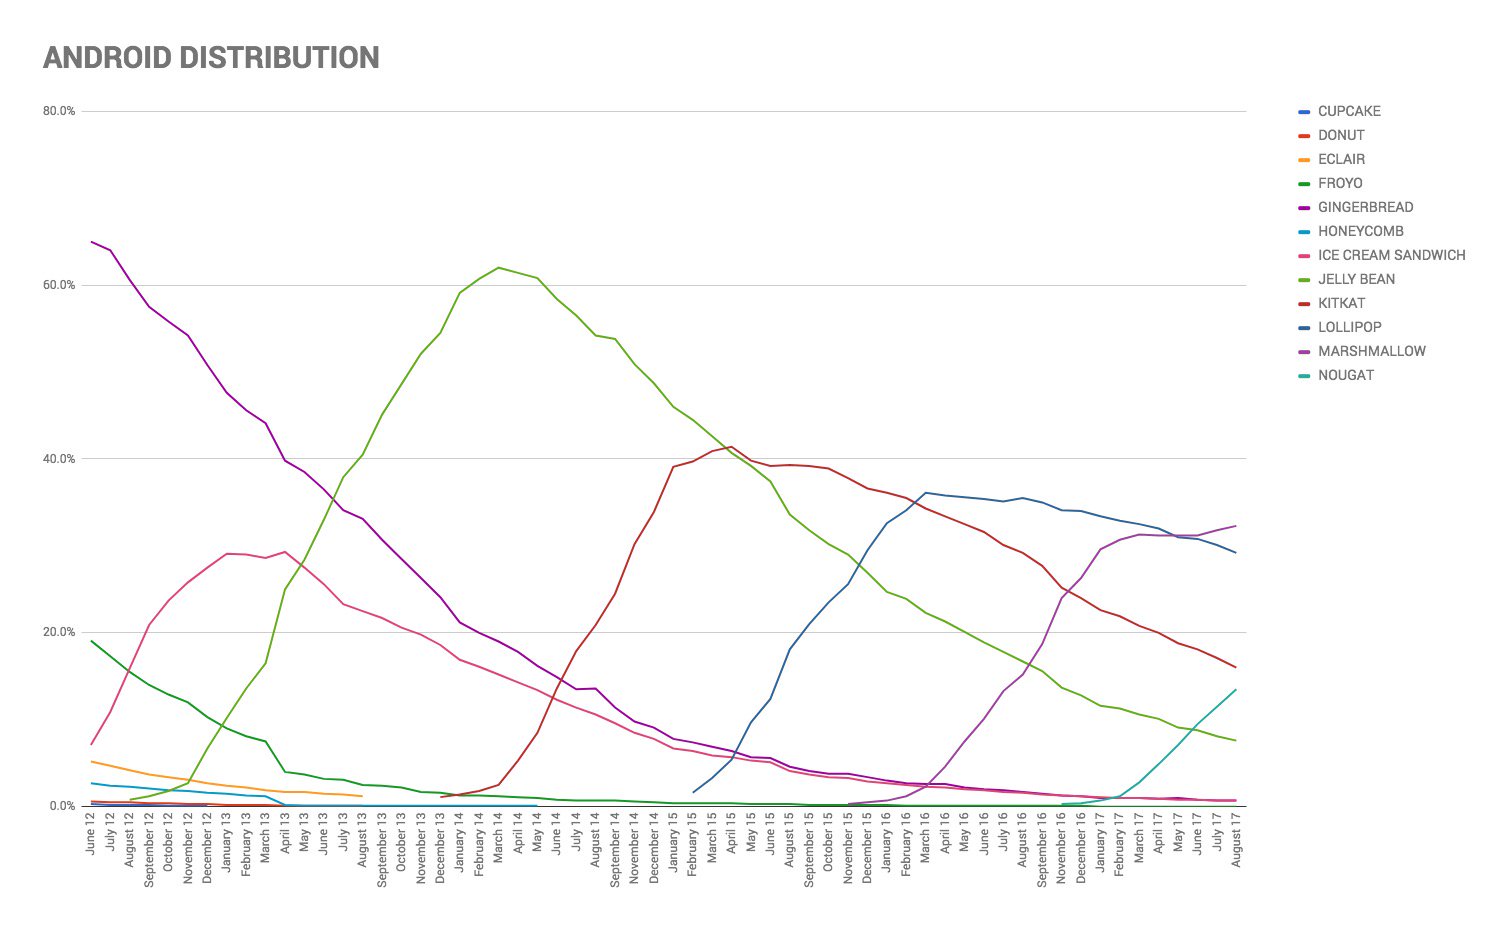
What becomes more than obvious about Android distribution over the past five years after looking at the charts is that the mobile operating system enjoyed quite irregular rolling out patterns. For example, Android Jelly Bean has been released in July 2012, and then KitKat came a long time after, in October 2013. Thus, Jelly Bean reached over 60% in distribution, which is an all-time high for Android, to be honest.
These percentages dropped more and more over the years. KitKat peaked at over 40% in distribution, and then Lollipop sat far behind with just 23%. The numbers are even lower with Android 7.0 Nougat, but you already knew that if you’re an Android user. So what is the reason for these dwindling numbers?
Well, it’s a little something called fragmentation, which basically means that, due to separate coding that needs to be done by each manufacturer and mobile carrier, it takes a whole lot more time for the tailored OS to reach devices. Android O will finally fix this though, which is good news.